Introduction
![]() In our example scenario, we are testing against “Oracle Database 11g Express Edition”, however the monitoring should be uniform across all Oracle database platforms. Our Opsview server is running on Ubuntu 10.04 32-bit, however this document can be altered to fit RHEL/CentOS/SLES etc and also 32/64 bit with some slight changes.
In our example scenario, we are testing against “Oracle Database 11g Express Edition”, however the monitoring should be uniform across all Oracle database platforms. Our Opsview server is running on Ubuntu 10.04 32-bit, however this document can be altered to fit RHEL/CentOS/SLES etc and also 32/64 bit with some slight changes.
Installation
Installation of the Oracle monitoring plugin requires installation of the Oracle “Instant Client”, along with the “alien” package and the check_oracle_health plugin we will be using. The steps needed are outlined later in the document.
1. Firstly, we will need to install our “alien” package, which we will need to convert the Oracle InstantClient files from .rpm to .deb (if we are installing on Debian/Ubuntu, if we are installing on CentOS/RHEL for example, we can leave it in the native .rpm format).
2. To do this, run “apt-get install alien”, for example – or if you prefer, download the offline version and run a “dpkg –I alien…deb”.
3. Next, we will need to download the 3 Oracle client files and install them from the link:
http://www.oracle.com/technetwork/topics/linuxsoft-082809.html
The files we need are:
oracle-instantclient11.2-basic-11.2.0.3.0-1.i386.rpm
oracle-instantclient11.2-devel-11.2.0.3.0-1.i386.rpm
oracle-instantclient11.2-sqlplus-11.2.0.3.0-1.i386.rpm
However the file names may be slightly different, depending on version number and architecture (32 vs 64 bit). You may need to sign up for a www.oracle.com account if you do not already have one.
4. Now that we have the 3 RPM’s above, we will need to install them. On CentOS/RHEL, this is easily done via “rpm –ivh oracle…rpm”, in the order of “basic”, then “devel”, then “sqlplus”. If we are installing on Debian/Ubuntu, we will need to convert the .rpm to .deb using alien and then install, as below:
sudo alien –to-deb oracle-instantclient11.2-basic-11.2.0.3.0-1.i386.rpm
dpkg -i oracle-instantclient11.2-basic_11.2.0.3.0-2_i386.deb
sudo alien –to-deb oracle-instantclient11.2-devel-11.2.0.3.0-1.i386.rpm
dpkg -i oracle-instantclient11.2-devel_11.2.0.3.0-2_i386.deb
sudo alien –to-deb oracle-instantclient11.2-sqlplus-11.2.0.3.0-1.i386.rpm
dpkg -i oracle-instantclient11.2-devel_11.2.0.3.0-2_i386.deb
5. Next, we will need to set the bash variables of our user running the oracle client. To do this, we must edit the “~.bashrc” file, and add the lines below:
export ORACLE_HOME=/usr/lib/oracle/11.2/client
export PATH=$PATH:$ORACLE_HOME/bin
export LD_LIBRARY_PATH=$ORACLE_HOME/lib
This points our variables to the correct location. Once set, we will need to load them into the active config via the command “source ~/.bashrc”.
6. Next, we will need to download the DBD::Oracle file needed to run the script. We can get this via the cpan CLI command, or via the link http://search.cpan.org/CPAN/authors/id/P/PY/PYTHIAN/DBD-Oracle-1.44.tar.gz
Once we have downloaded the file to our Opsview system, we will need to extract, and then compile, as below:
tar –zxvf DBD-Oracle-1.44.tar.gz
cd DBD-Oracle-1.44
perl MakeFile.PL
make
sudo make install
7. Now that we have installed DBD::Oracle, we will need to download and compile the plugin we will be using to monitor Oracle; called check_oracle_health (current version at writing is 1.7.3). To do this, we will need to run the commands below:
cd /tmp
wget http://labs.consol.de/wp-content/uploads/2011/09/check_oracle_health-1.7.3.tar.gz
tar –zxvf check_oracle_health-1.7.3.tar.gz
cd / check_oracle_health-1.7.3
./configure –prefix=/usr/local/nagios –with-nagios-user=nagios –with-nagios-group=nagios –with-perl=/usr/bin/perl –with-statefiles-dir=/tmp
make
sudo make install
With these commands, we are configuring the plugin with the full paths to our Perl files, and our nagios files. The make/make install then compiles the plugin, and automatically moves it to the plugin directory (located at /usr/local/nagios/libexec).
8. We can now test our plugin. First, let’s go to the plugin directory above; “cd /usr/local/nagios/libexec”. Now we can run the plugin against our oracle host using a simple tnsping, as below:
smarsh@demo:/usr/local/nagios/libexec$ ./check_oracle_health –connect=192.168.12.126 –mode=tnsping
OK – connection established to 192.168.12.126.
Where “–connect=192…” is the location we specify our Oracle server, and “–mode=” is where we specify what we’d like to do, in this case a “tnsping”. As above, we should get a “OK – connection established” message, if not, or we get timeouts, please check to ensure that the ports are open on the firewall to allow connectivity.
9. Now that we have the plugin installed and tested working, we can begin the simpler task of configuring Opsview to utilize the plugin.
10. Log into your Opsview installation, and click on “SETTINGS -> ATTRIBUTES” and click on the green “plus icon” in the top left. We will need to create 2 attributes, a “Oracle User” and an “Oracle Password”, which are the credentials we will use to login to the Oracle server.
NB: We could specify these manually in the service check, but the problem would arise if you wanted to monitor 2 Oracle servers with different credentials, you would need 2 different service checks as we hard coded them. This way is much more elegant. Visit our Opsview Configuration section for more information on attributes.
Once we have added our attributes, we should have a screen as below:

11. Next, lets go to “SETTINGS -> SERVICE CHECKS”, and then the green “plus icon” in the top left. In the service check template, we can now begin to create our new service checks. In our example, we are going to monitor how much free space in MB we have in the “SYSTEM” tablespace, using the command:
“check_oracle_health –connect=$HOSTADDRESS$ –user=%ORAUSER% –password=%ORAPWD% –name=system –mode=tablespace-free –units=MB”
As you can see, we have entered our new attributes into the service check. We can populate the service check to our liking, however the important point at this stage is to choose “check_oracle_health” in the plugins section, and enter “–connect=$HOSTADDRESS$ –user=%ORAUSER% –password=%ORAPWD% –name=system –mode=tablespace-free –units=MB” in the arguments section, so we have a screen as below:
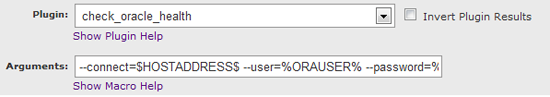
Click on “submit changes”, and our new service check, in our example called “Oracle – Tablespace Free”, is created.
12. Finally, we need to add our Oracle host and add the new service check to it. To begin, navigate to “SETTINGS > HOSTS” and click the green plus icon in the top left.
As per the standard way, enter the hostname/IP of the Oracle server in “Primary Hostname/IP”, and the verbose name we will reference it as, in the “Host Title” name; in our example we are going to refer to it as “Oracle”.
Once we have configured the “HOST” tab, we will next need to move onto the “Monitors” tab, and select our new service check, as below:

Finally, we will need to click on the “ATTRIBUTES” tab, and add 2 new attributes; one for oracle user and one for oracle password, and populate with the correct details for the oracle host, as below:
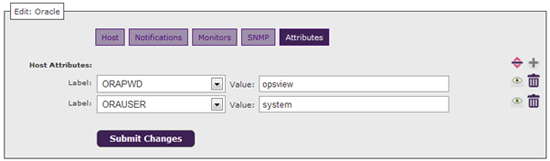
These values will be pulled into any service check ran against this host, that references the attributes %ORAPWD%, for example.
Click on submit, and our new Oracle host with our new service checks will be created.
13. Finally, we will need to apply our changes. To do this, navigate to “SETTINGS > APPLY CHANGES” and click “reload configuration”.
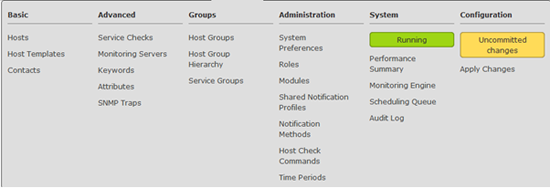
Our new host and service checks will now be active and running. To view them, navigate to “MONITORING > HOSTS” and click on your new host, Oracle, to view the service checks.
14. In our demo environment, we have the below service checks configured:
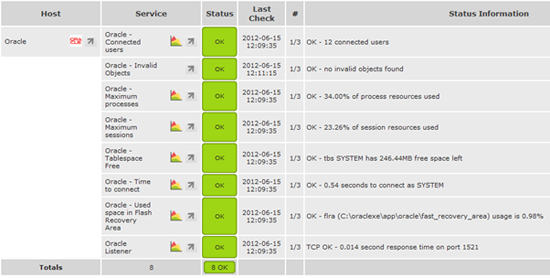
However, there are many more to add and they are all available if you run the command “./check_oracle_health -h”. Most are simply option changes after “–mode=”, and you add them exactly the same method as we did in the earlier steps.
Leave a Reply